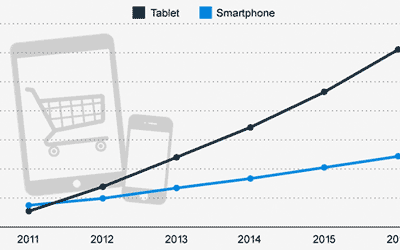
Released on March 10, 2013, the Nielsen “Australian Connected Consumers Report 2013” provides insights into the evolving patterns of consumers’ media consumption. Data includes the aggregate time spent on the Internet per day, connectivity during the hours of the day, how age is reflected in device usage patterns, and the increase in ‘out of home’ Internet access. …Read More…

The dramatic rise of Pinterest in one easy-to-read infographic. For more graphical information, search our recent infographic blogs or visit our Pinterest board. Source: internetmarketing.com

How do you present hard retail data in an interesting and visually arresting way? With infographics, of course! In recently developing a website for the owner and manager of multiple Sydney community shopping centres and retail strips, the amount of data rapidly approached overwhelming. To present this data entirely in figures would lack impact. The …Read More…

In 2013, mobile phones will overtake desktops as the most commonly used device to access the web. This infographic from KissMetrics demonstrates some of the dramatic changes which are occurring. One study found that the mention of a location or city name in a mobile ad can improve click-through rates by 200%. (Click image to enlarge) …Read More…

The pace of change continues to accelerate. UK smartphone owners spend twice as much time online, than they do on voice calls. British telco O2 has reported that each day, UK smartphone owners on average, spend 24.8 minutes browsing the web, 17.5 minutes on social networks and 14.4 minutes playing games, but only 12.1 minutes actually …Read More…

We are not yet in the world of “Jonathan E”, where the world and the Rollerball teams are run by global sector monopolies (Transport, Food, Communications, Housing, Luxury, and Energy). However, today, the revenues of the world’s biggest corporations (and the major banks who hold their stock) are larger than many national economies. Seven of …Read More…

Projections have just been updated by Forrester Research for the next 5 years of U.S. m.commerce The reputable company predicts that US mobile payments will reach US$90 billion by 2017, a 48% compound annual growth rate (CAGR) from the US$12.8 billion spent in 2012. Forrester’s five-year mobile payments forecast segments mobile payments into three categories: in-store mobile …Read More…

Erik Qualman (author of “Socialnomics”), has released a 2013 version of his now famous animated video, “Social Media Revolution“. Emphasising the astounding growth of social media, it includes examples like the Facebook launch of the Ford Explorer, which generated more traffic than a Superbowl ad! To have delivered more traffic than this behemoth, is an …Read More…

As the use of social networks increases, so to do the methods of measuring influence. Three platforms which evaluate your social activity and influence are Klout, Kred and PeerIndex. Social tools give individuals a mass-broadcast platform, which is more networked and therefore offers a potentially broader audience than any soapbox, pulpit, microphone, newspaper or television broadcast. …Read More…

In front of Parliament House, Canberra today, an authoritative report was launched on the largely hidden issue of hunger throughout Australia. Photographs of faces of food recipients highlighted the issue. The End Hunger Report was commissioned by Foodbank Australia, with analysis undertaken by Deloitte Access Economics. The report presents data from a survey of the 2,500 welfare agencies …Read More…