Human are inverterate collectors. Objects, ideas, and now digital images on social networks. But with the digital world at your fingertips, how do you choose where to store it and what to collect? Famous faces, inked bodies, cute kittens, playful puppies, pithy sayings and gorgeous landscapes. All are proving massively popular. The categorisation is entirely …Read More…

You don’t make a billion dollar investment, without taking measures to protect it! Just days after Twitter‘s video platform Vine, attained more linked tweets in a day than Instagram, Facebook has moved to recapture video market share with the launch of 15 second videos on Instagram. This was clearly a well-planned initiative. That Video on Instagram was …Read More…

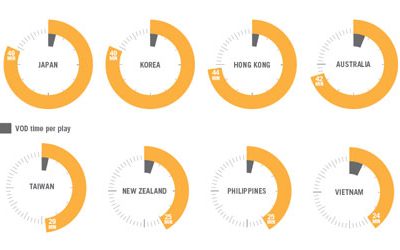
Over the 12 months to 2013, time spent watching video on mobile devices has doubled. In the first 3 months of 2013, the market share of video viewed on handheld devices grew by 19 percent. In a 24 hour period on 7 June, tweets with links to Vine, exceeded those to Instagram. Within 2 weeks, …Read More…

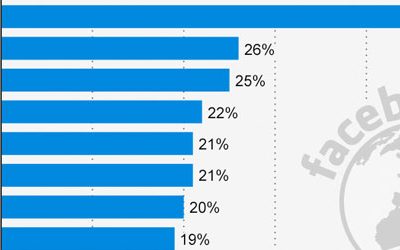
More people on the Internet are communicating via social media than ever before, and Facebook is the most popular platform. In the first quarter of 2013,  over half the world’s Internet connected population is using Facebook! Using data collated by Global Web Index, Statista has just released a chart of the world’s ten largest social media sites by …Read More…

The growth rate of mobile Internet access has exceeded that of initial Internet growth. Statista has just released a chart to demonstrate this comparison. The compound annual growth rate (CAGR) figures for global internet traffic between 1997 and 2003, show a 127% annual increase. Mobile IP traffic however, has now reached an annual growth rate of 146%. Mobile traffic in …Read More…

All the image measurements for your brand’s social media presence, in one (extensive) infographic. For more graphical information, search our recent infographic blogs or visit our Pinterest board. Source: tentsocial.com

An infographic on the rapidly increasing use of a ‘second screen’ while watching television. For more graphical information, search our recent infographic blogs or visit our Pinterest board. Source: confused.com

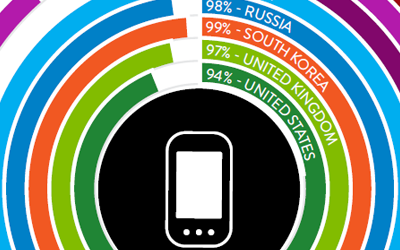
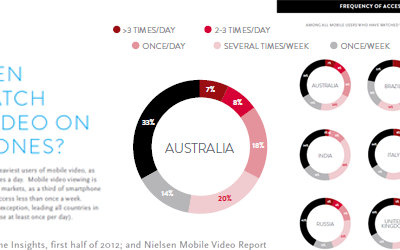
Nielsen has just released a report “The Mobile Consumer. A Global Snapshot, February 2013” The research covers 9 countries across 5 continents: Australia, Brazil, China, India, Italy, Russia, South Korea, United Kingdom, United States. Interesting data reveals world leadership by the rapidly developing BRIC countries: In Brazil, 75% of the respondents use their mobiles for social networking, …Read More…

Released on March 10, 2013, the Nielsen “Australian Connected Consumers Report 2013” provides insights into the evolving patterns of consumers’ media consumption. Data includes the aggregate time spent on the Internet per day, connectivity during the hours of the day, how age is reflected in device usage patterns, and the increase in ‘out of home’ Internet access. …Read More…

By now, you may have repeatedly heard that if Facebook was a country, it would be the third largest (by population) in the world. Facebook is a massive platform for brands. As a part of a customised eStrategy, Digital Tsunami counsels brands on the use of Facebook pages for their products and services, to access a global market of …Read More…