 13 Reasons Why Your Brain Craves Infographics [Infographic] by the team at NeoMam
View more infographic blogs
View more infographics on Pinterest
Source: neomam.com
13 Reasons Why Your Brain Craves Infographics [Infographic] by the team at NeoMam
View more infographic blogs
View more infographics on Pinterest
Source: neomam.comInfographic
-
Dynamic infographic on .. well, Infographics!
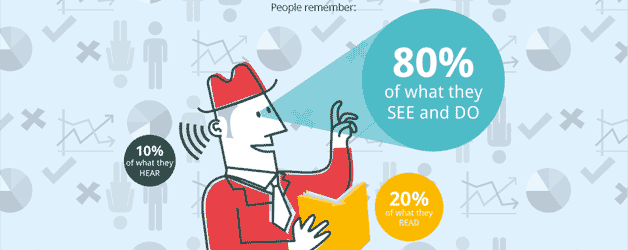
June 12, 2013To explain the rationale behind the visual presentation of facts, and promote the benefits, Manchester infographic studio NeoMam has produced a dynamic parallax scrolling infographic. Built in HTML5 (the cross-platform compatible successor to Flash), the infographic clearly reinforces the power of visualising information.
13 Reasons Why Your Brain Craves Infographics [Infographic] by the team at NeoMam
View more infographic blogs
View more infographics on Pinterest
Source: neomam.com -
Social Media Design Blueprint
March 26, 2013All the image measurements for your brand's social media presence, in one (extensive) infographic. For more graphical information, search our recent infographic blogs or visit our Pinterest board. Source: tentsocial.com
 -
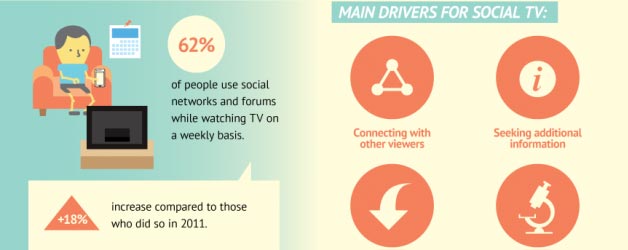
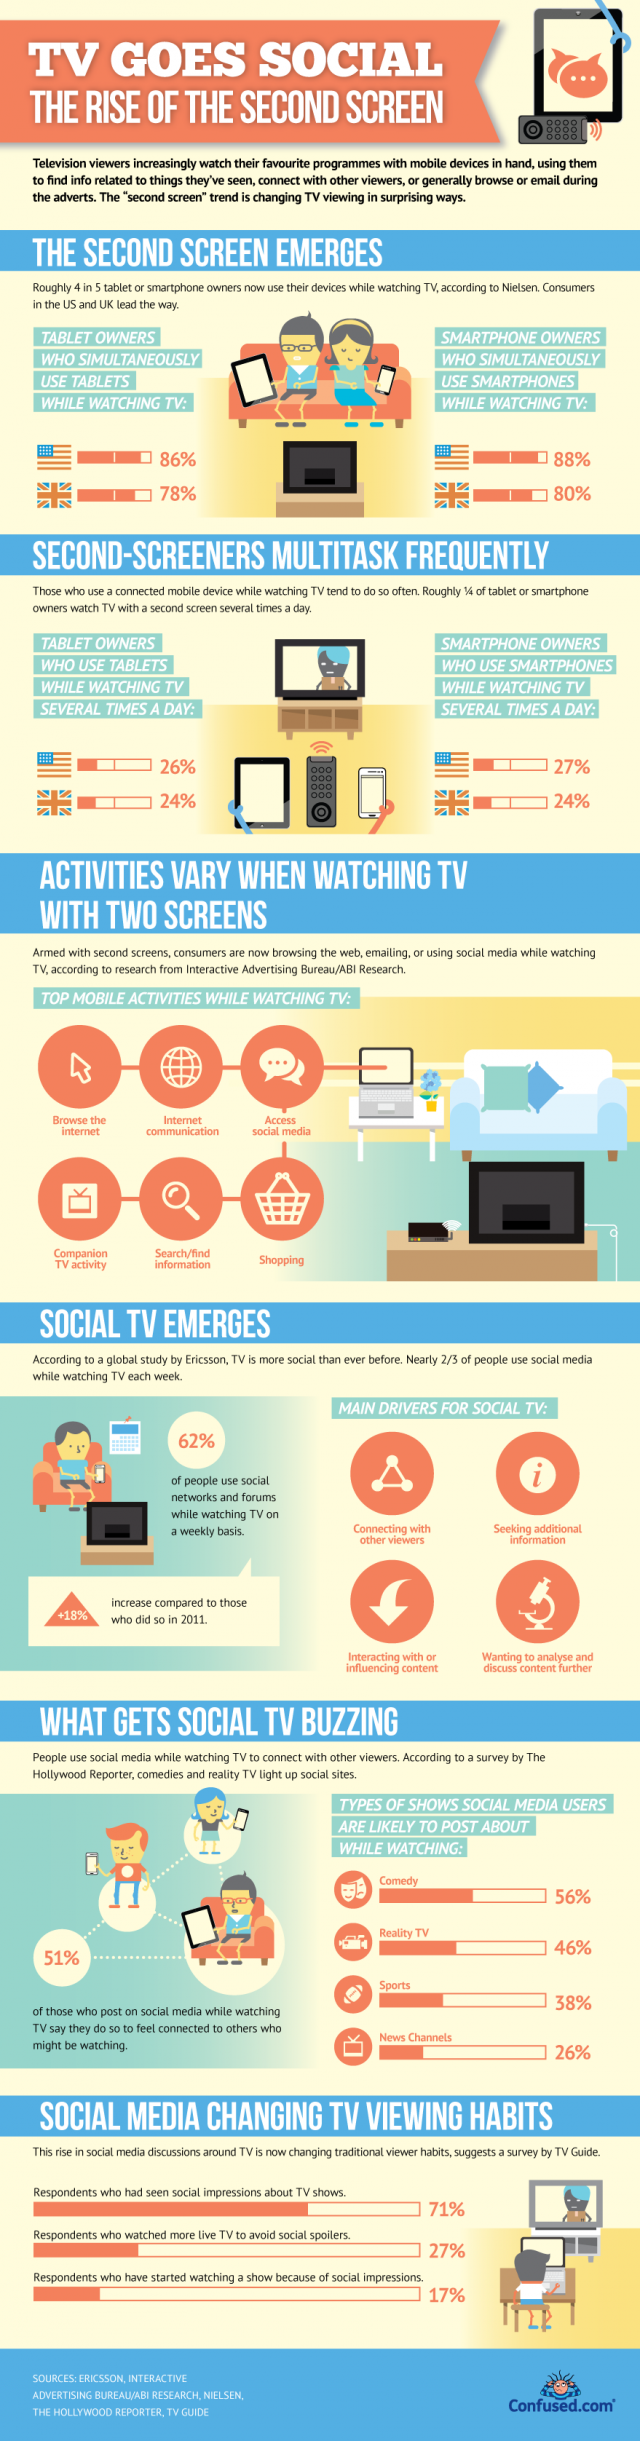
Second screen infographic
March 22, 2013An infographic on the rapidly increasing use of a 'second screen' while watching television. For more graphical information, search our recent infographic blogs or visit our Pinterest board.
Source: confused.com
For more graphical information, search our recent infographic blogs or visit our Pinterest board.
Source: confused.com -
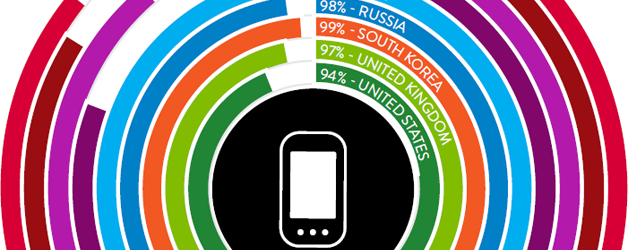
The Mobile Consumer – 2012 statistics
March 19, 2013Nielsen has just released a report "The Mobile Consumer. A Global Snapshot, February 2013" The research covers 9 countries across 5 continents: Australia, Brazil, China, India, Italy, Russia, South Korea, United Kingdom, United States. Interesting data reveals world leadership by the rapidly developing BRIC countries:- In Brazil, 75% of the respondents use their mobiles for social networking, far higher than any other country in the survey
- 97% of the population in Russia (age 16+) owns a mobile phone, (only South Korea is higher at 98%)
- The country where mobile video viewing has most affected TV viewing is India, where 28% of respondents reported watching less traditional TV
- The highest frequency of mobile video views is in China, where 17% of smartphone owners watch mobile video more than 3 times a day
- owner demographics
- ownership of types of phones
- multiple device ownership
- mobile phone plans and costs
- purchase location and criteria
- mobile apps used
- mobile video hours and methods
- the impact on TV viewing time
- mobile advertising
-
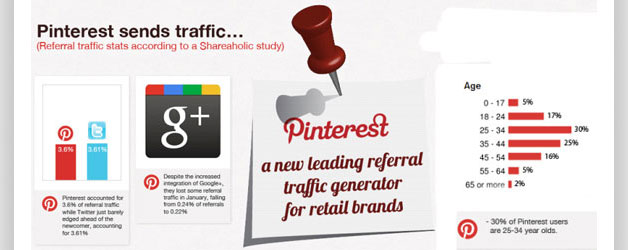
Pinterest infographic
March 1, 2013The dramatic rise of Pinterest in one easy-to-read infographic.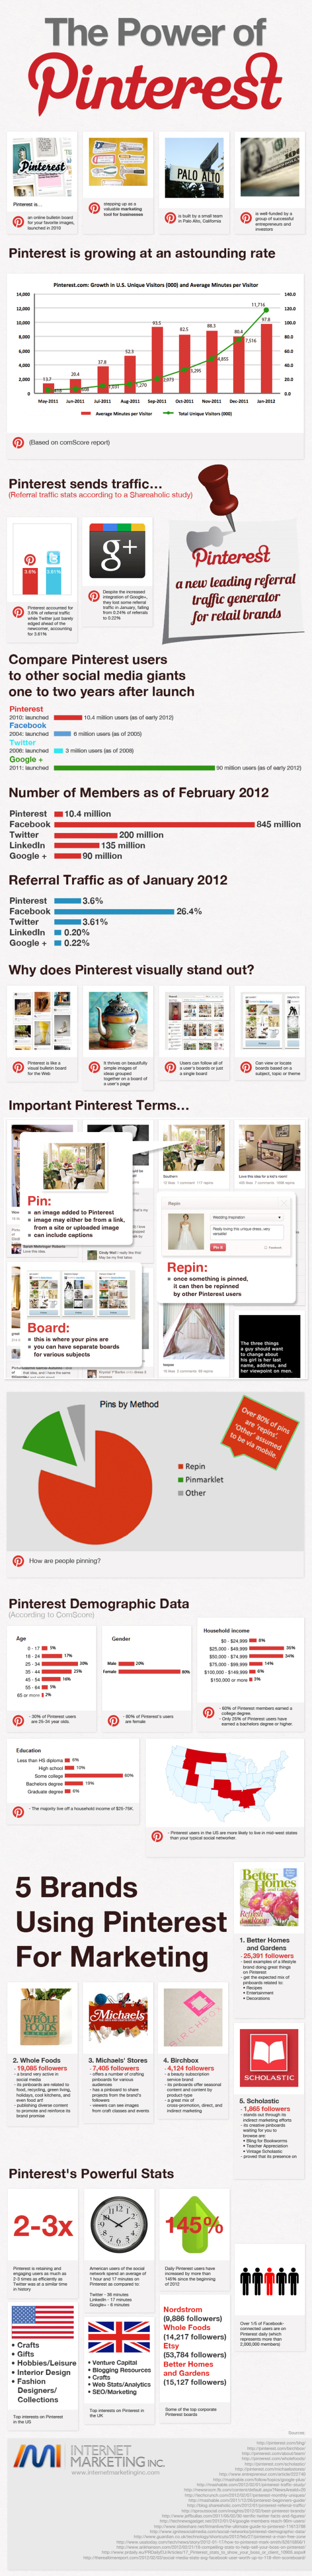 For more graphical information, search our recent infographic blogs or visit our Pinterest board.
Source: internetmarketing.com
For more graphical information, search our recent infographic blogs or visit our Pinterest board.
Source: internetmarketing.com -
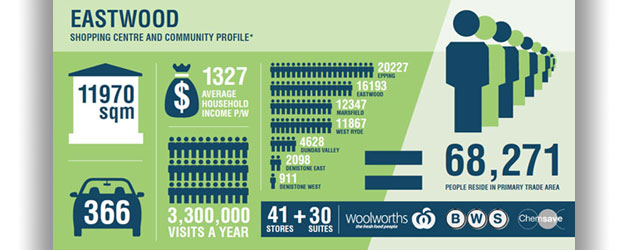
Infographics bring retail data to life
March 1, 2013How do you present hard retail data in an interesting and visually arresting way? With infographics, of course! In recently developing a website for the owner and manager of multiple Sydney community shopping centres and retail strips, the amount of data rapidly approached overwhelming. To present this data entirely in figures would lack impact. The design and development teams collaborated on the concept and creation of infographics to convey a wealth of information rapidly, consistently and powerfully. Large numbers were represented by iconography which segmented and rendered the data immediately clear. Across 8 community retail locations, data on; catchment area demographics;, suburb populations; average weekly income; annual shopper traffic; centre size; number of retailers and number of car parks; was presented consistently. Banna Property Group manages over 50,000m2 of retail space across metropolitan Sydney, from retail strips to large, community-based shopping centres. Banna focuses on property management, retail and commercial leasing and property development projects. Visit the site to view the infographics. Search our recent infographic blogs. View an infographics board on Pinterest. -

Corporations and Countries: The Biggest
January 27, 2013We are not yet in the world of "Jonathan E", where the world and the Rollerball teams are run by global sector monopolies (Transport, Food, Communications, Housing, Luxury, and Energy). However, today, the revenues of the world's biggest corporations (and the major banks who hold their stock) are larger than many national economies. Seven of the top 10 are oil and gas companies. Royal Dutch Shell has revenues higher than all but 25 of the world's largest national economies. Exxon Mobil, SinoPec and BP are individually larger than all but the top 29 nations. Five of the top 25 corporations are automotive groups: Toyota, Volkswagen, GM, Daimler and Ford. The annual revenue of Warren Buffet's investment firm Berkshire Hathaway, is greater than the GDP of most of the world's nations. Could these companies be managed more efficiently than some countries? An infographic from visual.ly (using data from TNI) presents this comparison in a powerful visual form. -
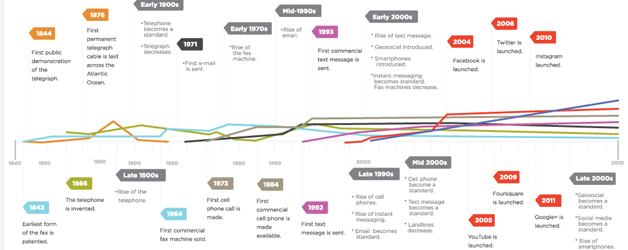
Charting Communications Evolution
October 1, 2012The increasingly rapid rate of technological innovation is displayed graphically in an infographic entitled the Changing Consumer. In the century following the first public demonstration of the telegraph in 1844, the single major telecommunications development was the telephone. In the last 30 years of the 20th century, fax, cellphones and text messages emerged and grew rapidly. In the last decade, Geosocial platforms have launched, and together with the dramatic rise of smartphones, are becoming the prime means of social communication. The number of people using social media has grown from fewer than 4 million in 2005 to over 1.5 billion in 2012. Earlier this century, the founder of Digital Tsunami coined a phrase for this rapid technological and sociological change: 'Communications Evolution'. Source: Drumbi
 -
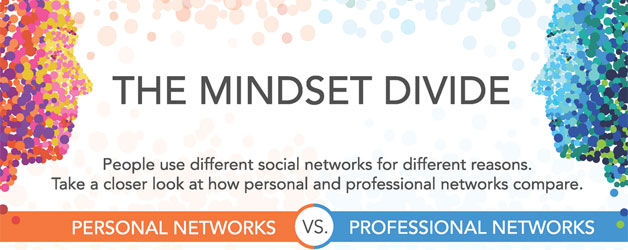
The great mindset divide
September 26, 2012Is there a difference between your mindset when using a professional network and a social network? Not only has LinkedIn said "Yes", but has produced an infographic to explain the rationales and provide insights into our behaviours. Source: LinkedIn
-
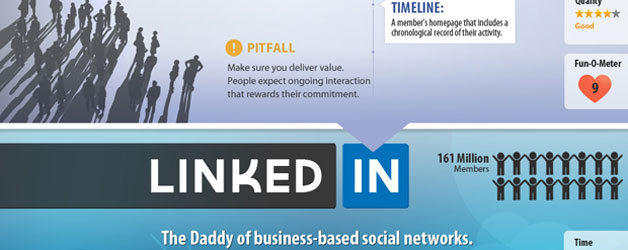
Social Networks for Business
August 21, 2012Why are so many infographics based on social networks and business? Simply because social networks are so critical to marketing and the numbers just keep increasing. Plus, they make for great visuals! This infographic from the folks at SDL | SM2 concisely presents and evaluates the top nine social media networks for business. Companies are increasingly utilising YouTube as a highly cost effective global broadcast platform with an inbuilt search engine and social distribution network. LinkedIn offers access to over 160 million professionals around the globe (and their companies). Brands, from a range as diverse as major film studios and philanthropic organisations, are creating and maintaining Facebook pages for their products and services, to access a global market of almost one billion consumers. Pinterest, Twitter, FourSquare and others may seem, (and may be), peripheral to your marketing strategy, but an informed understanding of social media and an effective custom strategy is critical for every business. (click to zoom) Source SDL | SM2
 Source:


