Of the 70 million Pinterest users1, 49 million are in the USA and 85% are female2. In fact 42% of adult American women have a Pinterest account. Retailers recognise the immense buying power which this represents. Pinterest is a site which enables users to upload and collate photographs and videos linked to other webpages. Users …Read More…

Increasingly, companies are embracing the importance of engaging in a conversation on social media, in order to build brand recognition and communicate directly with consumers. But faced with a plethora of platforms, many are asking us, “Which social media are relevant to my company?” Our answer is that whilst there is no ‘cookie cutter’ formula, the choices you …Read More…

Last year, we predicted that the three most critical promotional tools for the year were mobile social media video This proved true, and these three will remain essential in 2014. However, the success of each has necessitated even greater effectiveness to attain cut-through in markets where there is massive competition for customer attention. Here are …Read More…

To explain the rationale behind the visual presentation of facts, and promote the benefits, Manchester infographic studio NeoMam has produced a dynamic parallax scrolling infographic. Built in HTML5 (the cross-platform compatible successor to Flash), the infographic clearly reinforces the power of visualising information. 13 Reasons Why Your Brain Craves Infographics [Infographic] by the team at …Read More…

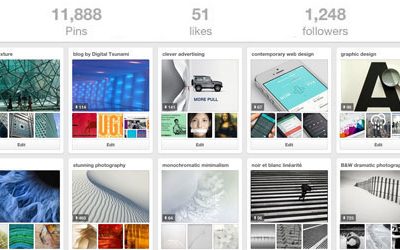
All the image measurements for your brand’s social media presence, in one (extensive) infographic. For more graphical information, search our recent infographic blogs or visit our Pinterest board. Source: tentsocial.com

An infographic on the rapidly increasing use of a ‘second screen’ while watching television. For more graphical information, search our recent infographic blogs or visit our Pinterest board. Source: confused.com

The dramatic rise of Pinterest in one easy-to-read infographic. For more graphical information, search our recent infographic blogs or visit our Pinterest board. Source: internetmarketing.com

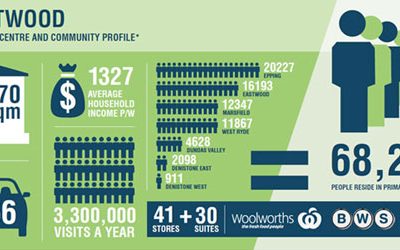
How do you present hard retail data in an interesting and visually arresting way? With infographics, of course! In recently developing a website for the owner and manager of multiple Sydney community shopping centres and retail strips, the amount of data rapidly approached overwhelming. To present this data entirely in figures would lack impact. The …Read More…

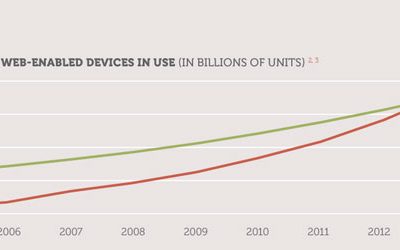
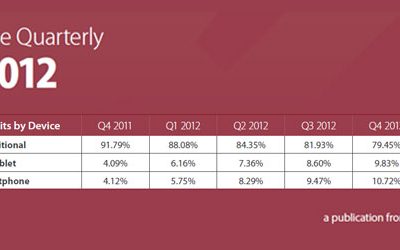
In 2013, mobile phones will overtake desktops as the most commonly used device to access the web. This infographic from KissMetrics demonstrates some of the dramatic changes which are occurring. One study found that the mention of a location or city name in a mobile ad can improve click-through rates by 200%. (Click image to enlarge) …Read More…

The pace of change continues to accelerate. UK smartphone owners spend twice as much time online, than they do on voice calls. British telco O2 has reported that each day, UK smartphone owners on average, spend 24.8 minutes browsing the web, 17.5 minutes on social networks and 14.4 minutes playing games, but only 12.1 minutes actually …Read More…