We are not yet in the world of “Jonathan E”, where the world and the Rollerball teams are run by global sector monopolies (Transport, Food, Communications, Housing, Luxury, and Energy). However, today, the revenues of the world’s biggest corporations (and the major banks who hold their stock) are larger than many national economies. Seven of …Read More…

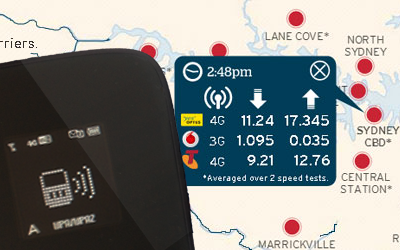
Fairfax Media Deputy Technology Editor, Ben Grubb, has today published an interactive graphic of the results of a recent connectivity test around Sydney. The graphic, designed with Francisca Sallato, displays statistics of the test results which used multiple smartphone and ISPs to access the Internet, in a variety of locations across Sydney. The volume of data which …Read More…

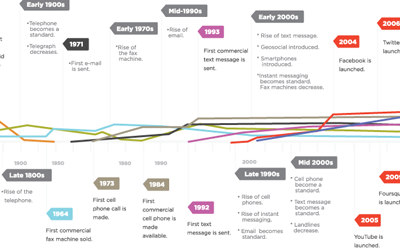
The increasingly rapid rate of technological innovation is displayed graphically in an infographic entitled the Changing Consumer. In the century following the first public demonstration of the telegraph in 1844, the single major telecommunications development was the telephone. In the last 30 years of the 20th century, fax, cellphones and text messages emerged and grew …Read More…

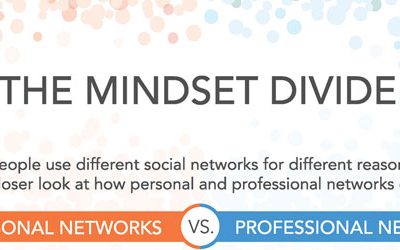
Is there a difference between your mindset when using a professional network and a social network? Not only has LinkedIn said “Yes“,  but has produced an infographic to explain the rationales and provide insights into our behaviours.   Source: LinkedIn  

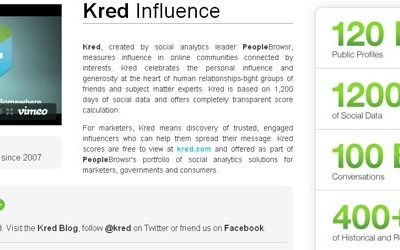
As the use of social networks increases, so to do the methods of measuring influence. Three platforms which evaluate your social activity and influence are Klout, Kred and PeerIndex. Social tools give individuals a mass-broadcast platform, which is more networked and therefore offers a potentially broader audience than any soapbox, pulpit, microphone, newspaper or television broadcast. …Read More…

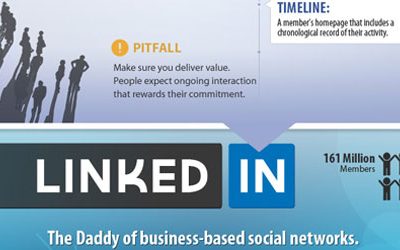
Why are so many infographics based on social networks and business? Simply because social networks are so critical to marketing and the numbers just keep increasing. Plus, they make for great visuals! This infographic from the folks at SDL | SM2 concisely presents and evaluates the top nine social media networks for business. Companies are increasingly utilising YouTube …Read More…

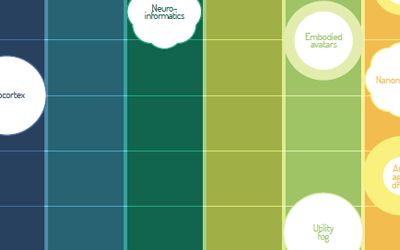
Wanna see the future? The researchers, scientists, strategists and futurists at envisioningtech.com have  created a comprehensive infographic of future technological developments to the year 2040. The timeline projects emerging technologies in the categories of AI (Artificial Intelligence), BioTech, energy, GeoEngineering, interfaces, the Internet, materials, robotics, sensors, space and UbiComp (ubiquitous computing). Presented by Michell Zappa as a keynote at the Global Futures Forum in Washington, D.C., many of the technologies of today will …Read More…